package
0.0.0-20240819164739-f47aed85de5a
Repository: https://github.com/unix-world/smartgo.git
Documentation: pkg.go.dev
# README
asciigraph
Go package to make lightweight ASCII line graphs ╭┈╯.
Installation
go get -u github.com/guptarohit/asciigraph@latest
Usage
Basic graph
package main
import (
"fmt"
"github.com/guptarohit/asciigraph"
)
func main() {
data := []float64{3, 4, 9, 6, 2, 4, 5, 8, 5, 10, 2, 7, 2, 5, 6}
graph := asciigraph.Plot(data)
fmt.Println(graph)
}
Running this example would render the following graph:
10.00 ┤ ╭╮
9.00 ┤ ╭╮ ││
8.00 ┤ ││ ╭╮││
7.00 ┤ ││ ││││╭╮
6.00 ┤ │╰╮ ││││││ ╭
5.00 ┤ │ │ ╭╯╰╯│││╭╯
4.00 ┤╭╯ │╭╯ ││││
3.00 ┼╯ ││ ││││
2.00 ┤ ╰╯ ╰╯╰╯
Multiple Series
package main
import (
"fmt"
"github.com/guptarohit/asciigraph"
)
func main() {
data := [][]float64{{0, 1, 2, 3, 3, 3, 2, 0}, {5, 4, 2, 1, 4, 6, 6}}
graph := asciigraph.PlotMany(data)
fmt.Println(graph)
}
Running this example would render the following graph:
6.00 ┤ ╭─
5.00 ┼╮ │
4.00 ┤╰╮ ╭╯
3.00 ┤ │╭│─╮
2.00 ┤ ╰╮│ ╰╮
1.00 ┤╭╯╰╯ │
0.00 ┼╯ ╰
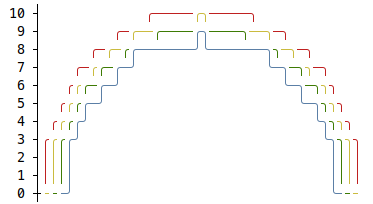
Colored graphs
package main
import (
"fmt"
"github.com/guptarohit/asciigraph"
)
func main() {
data := make([][]float64, 4)
for i := 0; i < 4; i++ {
for x := -20; x <= 20; x++ {
v := math.NaN()
if r := 20 - i; x >= -r && x <= r {
v = math.Sqrt(math.Pow(float64(r), 2)-math.Pow(float64(x), 2)) / 2
}
data[i] = append(data[i], v)
}
}
graph := asciigraph.PlotMany(data, asciigraph.Precision(0), asciigraph.SeriesColors(
asciigraph.Red,
asciigraph.Yellow,
asciigraph.Green,
asciigraph.Blue,
))
fmt.Println(graph)
}
Running this example would render the following graph:
CLI Installation
This package also brings a small utility for command line usage.
Assuming $GOPATH/bin
is in your $PATH
, install CLI with following command:
go install github.com/guptarohit/asciigraph/cmd/asciigraph@latest
or pull Docker image:
docker pull ghcr.io/guptarohit/asciigraph:latest
or download binaries from the releases page.
CLI Usage
> asciigraph --help
Usage of asciigraph:
asciigraph [options]
Options:
-ac axis color
y-axis color of the plot
-b buffer
data points buffer when realtime graph enabled, default equal to `width`
-c caption
caption for the graph
-cc caption color
caption color of the plot
-f fps
set fps to control how frequently graph to be rendered when realtime graph enabled (default 24)
-h height
height in text rows, 0 for auto-scaling
-lb lower bound
lower bound set the minimum value for the vertical axis (ignored if series contains lower values) (default +Inf)
-lc label color
y-axis label color of the plot
-o offset
offset in columns, for the label (default 3)
-p precision
precision of data point labels along the y-axis (default 2)
-r realtime
enables realtime graph for data stream
-sc series color
series color of the plot
-ub upper bound
upper bound set the maximum value for the vertical axis (ignored if series contains larger values) (default -Inf)
-w width
width in columns, 0 for auto-scaling
asciigraph expects data points from stdin. Invalid values are logged to stderr.
Feed it data points via stdin:
seq 1 72 | asciigraph -h 10 -c "plot data from stdin"
or use Docker image:
seq 1 72 | docker run -i --rm ghcr.io/guptarohit/asciigraph -h 10 -c "plot data from stdin"
Output:
72.00 ┤ ╭────
64.90 ┤ ╭──────╯
57.80 ┤ ╭──────╯
50.70 ┤ ╭──────╯
43.60 ┤ ╭──────╯
36.50 ┤ ╭───────╯
29.40 ┤ ╭──────╯
22.30 ┤ ╭──────╯
15.20 ┤ ╭──────╯
8.10 ┤ ╭──────╯
1.00 ┼──╯
plot data from stdin
Example of real-time graph for data points stream via stdin:
ping -i.2 google.com | grep -oP '(?<=time=).*(?=ms)' --line-buffered | asciigraph -r -h 10 -w 40 -c "realtime plot data (google ping in ms) from stdin"
Acknowledgement
This package started as golang port of asciichart.
Contributing
Feel free to make a pull request! :octocat:
# Packages
No description provided by the author
# Functions
AxisColor sets the axis color.
Caption sets the graphs caption.
CaptionColor sets the caption color.
Height sets the graphs height.
LabelColor sets the axis label color.
LowerBound sets the graph's minimum value for the vertical axis.
Offset sets the graphs offset.
Plot returns ascii graph for a series.
PlotMany returns ascii graph for multiple series.
Precision sets the graphs precision.
SeriesColors sets the series colors.
UpperBound sets the graph's maximum value for the vertical axis.
Width sets the graphs width.
# Variables
No description provided by the author
dummy value.
No description provided by the author
clear terminal screen.
No description provided by the author
# Interfaces
Option represents a configuration setting.
# Type aliases
No description provided by the author