# README
.. --restructuredtext--
asciigraph
.. image:: https://travis-ci.org/guptarohit/asciigraph.svg?branch=master :target: https://travis-ci.org/guptarohit/asciigraph :alt: Build status
.. image:: https://goreportcard.com/badge/github.com/guptarohit/asciigraph :target: https://goreportcard.com/report/github.com/guptarohit/asciigraph :alt: Go Report Card
.. image:: https://coveralls.io/repos/github/guptarohit/asciigraph/badge.svg?branch=master :target: https://coveralls.io/github/guptarohit/asciigraph?branch=master :alt: Coverage Status
.. image:: https://godoc.org/github.com/guptarohit/asciigraph?status.svg :target: https://godoc.org/github.com/guptarohit/asciigraph :alt: GoDoc
.. image:: https://img.shields.io/badge/licence-BSD-blue.svg :target: https://github.com/guptarohit/asciigraph/blob/master/LICENSE :alt: License
.. image:: https://awesome.re/mentioned-badge-flat.svg :target: https://github.com/avelino/awesome-go#advanced-console-uis :alt: Mentioned in Awesome Go
|
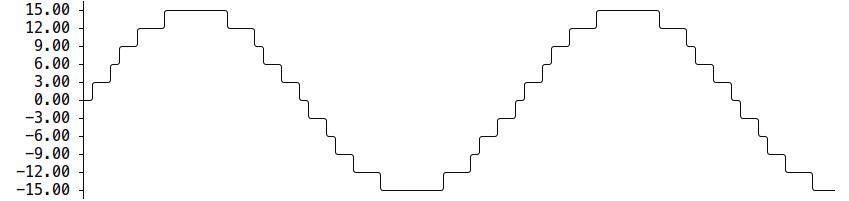
Go package to make lightweight ASCII line graphs ╭┈╯.
.. image:: https://user-images.githubusercontent.com/7895001/41509956-b1b2b3d0-7279-11e8-9d19-d7dea17d5e44.png
Installation
::
go get github.com/guptarohit/asciigraph
Usage
Basic graph ^^^^^^^^^^^
.. code:: go
package main

import (
    "fmt"
    "github.com/guptarohit/asciigraph"
)

func main() {
    data := []float64{3, 4, 9, 6, 2, 4, 5, 8, 5, 10, 2, 7, 2, 5, 6}
    graph := asciigraph.Plot(data)

    fmt.Println(graph)
}
Running this example would render the following graph:
::
10.00 ┤ ╭╮ 9.00 ┤ ╭╮ ││ 8.00 ┤ ││ ╭╮││ 7.00 ┤ ││ ││││╭╮ 6.00 ┤ │╰╮ ││││││ ╭ 5.00 ┤ │ │ ╭╯╰╯│││╭╯ 4.00 ┤╭╯ │╭╯ ││││ 3.00 ┼╯ ││ ││││ 2.00 ┤ ╰╯ ╰╯╰╯
..
Command line interface
This package also brings a small utility for command line usage. Assuming
$GOPATH/bin is in your $PATH, simply go get it then install CLI.
CLI Installation ^^^^^^^^^^^^^^^^
::
go install github.com/guptarohit/asciigraph/cmd/asciigraph
or download binaries from the releases <https://github.com/guptarohit/asciigraph/releases>_ page.
Feed it data points via stdin:
::
$ seq 1 72 | asciigraph -h 10 -c "plot data from stdin" 72.00 ┼ 65.55 ┤ ╭──── 59.09 ┤ ╭──────╯ 52.64 ┤ ╭──────╯ 46.18 ┤ ╭──────╯ 39.73 ┤ ╭──────╯ 33.27 ┤ ╭───────╯ 26.82 ┤ ╭──────╯ 20.36 ┤ ╭──────╯ 13.91 ┤ ╭──────╯ 7.45 ┤ ╭──────╯ 1.00 ┼──╯ plot data from stdin
..
Realtime graph for data points via stdin:
::
$ ping -i.2 google.com | grep -oP '(?<=time=).*(?=ms)' --line-buffered | asciigraph -r -h 10 -w 40 -c "realtime plot data (google ping in ms) from stdin" 8.26 ┤ ╭╮ 7.77 ┤ ││ 7.27 ┤ ││ 6.78 ┤ ││ ╭╮ 6.29 ┤ ╭╮ ╭╮ ││ ││ 5.79 ┤ ││ ││ ││ │╰╮ 5.30 ┤ ││ ││ ╭╮││ │ │ ╭ 4.81 ┤ ││ ││ ││││ │ │ │ 4.32 ┤ ╭╮ ││╭╯│ ╭╮ ││││ │ │ ╭╯ 3.82 ┼╮│╰─╯╰╯ │╭──╯╰─╯╰╯╰──╮ ╭───╮╭───╯ ╰──╯ 3.33 ┤╰╯ ╰╯ ╰─╯ ╰╯ realtime plot data (google ping in ms) from stdin
..
Acknowledgement
This package started as golang port of asciichart <https://github.com/kroitor/asciichart>_.
Contributing
Feel free to make a pull request! :octocat: