repositorypackage
0.0.1-rc.2
Repository: https://github.com/jschwinger233/ufuncgraph.git
Documentation: pkg.go.dev
# README
ufuncgraph
bpf(2)-based ftrace(1)-like function graph tracer for userspace processes.
Limits:
- Only Works for Go programs for now;
.symtabELF section is required, and.debug_infosection is preferable;- The Go binary must be built using static linking;
- Running on x86-64 little-endian Linux only;
- Kernel version has to support bpf(2) and uprobe, and I developped it on 5.14.0;
Example
Let's trace dockerd to see how it handles docker stop:
Type the command:
sudo ufuncgraph -d 1 ./bundles/binary-daemon/dockerd '!runtime.*' '!context.*' '!*vendor*' 'github.com/docker/docker/daemon.(*Daemon).containerStop(id=+0(+64(%rdi)):c256, name=+0(+200(%rdi)):c256, name_len=+208(%rdi):s32)'
Explanations:
-d 1: search the functions called bygithub.com/docker/docker/daemon.(*Daemon).containerStop, and only search for one layer;!runtime.*: ignore the functions matching the wildcardruntime.*;!context.*: ignore the functions matching the wildcardcontext.*;!*vendor*: ignore the functions matching the wildcard*vendor*;github.com/docker/docker/daemon.(*Daemon).containerStop(id=+0(+64(%rdi)):c256, name=+0(+200(%rdi)):c256, name_len=+208(%rdi):s32): attach the functiongithub.com/docker/docker/daemon.(*Daemon).containerStop, and fetch the argumentsid,nameandname_lenusing Linux uprobe_tracer's FETCHARGS syntax.
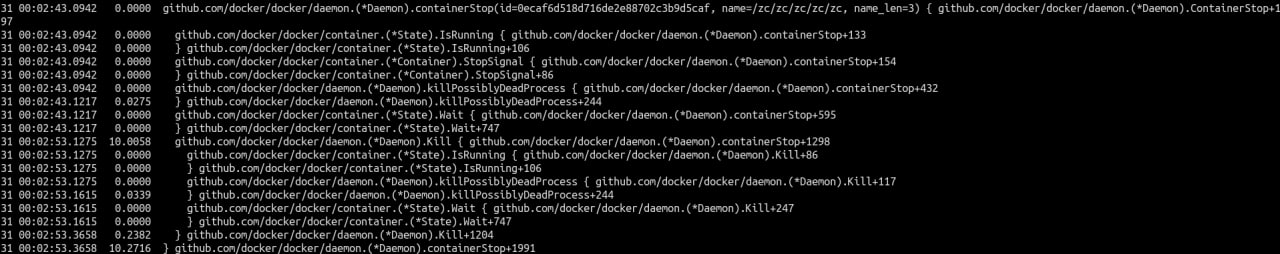
And will get the results:
Use cases
- Wall time profiling;
- Execution flow observing;
Wall time profiling case
Chinese version: https://roamresearch.com/#/app/FEZ/page/C-xt1C2M1
Execution flow observing
Chinese version: https://roamresearch.com/#/app/FEZ/page/ya-t0xN8m